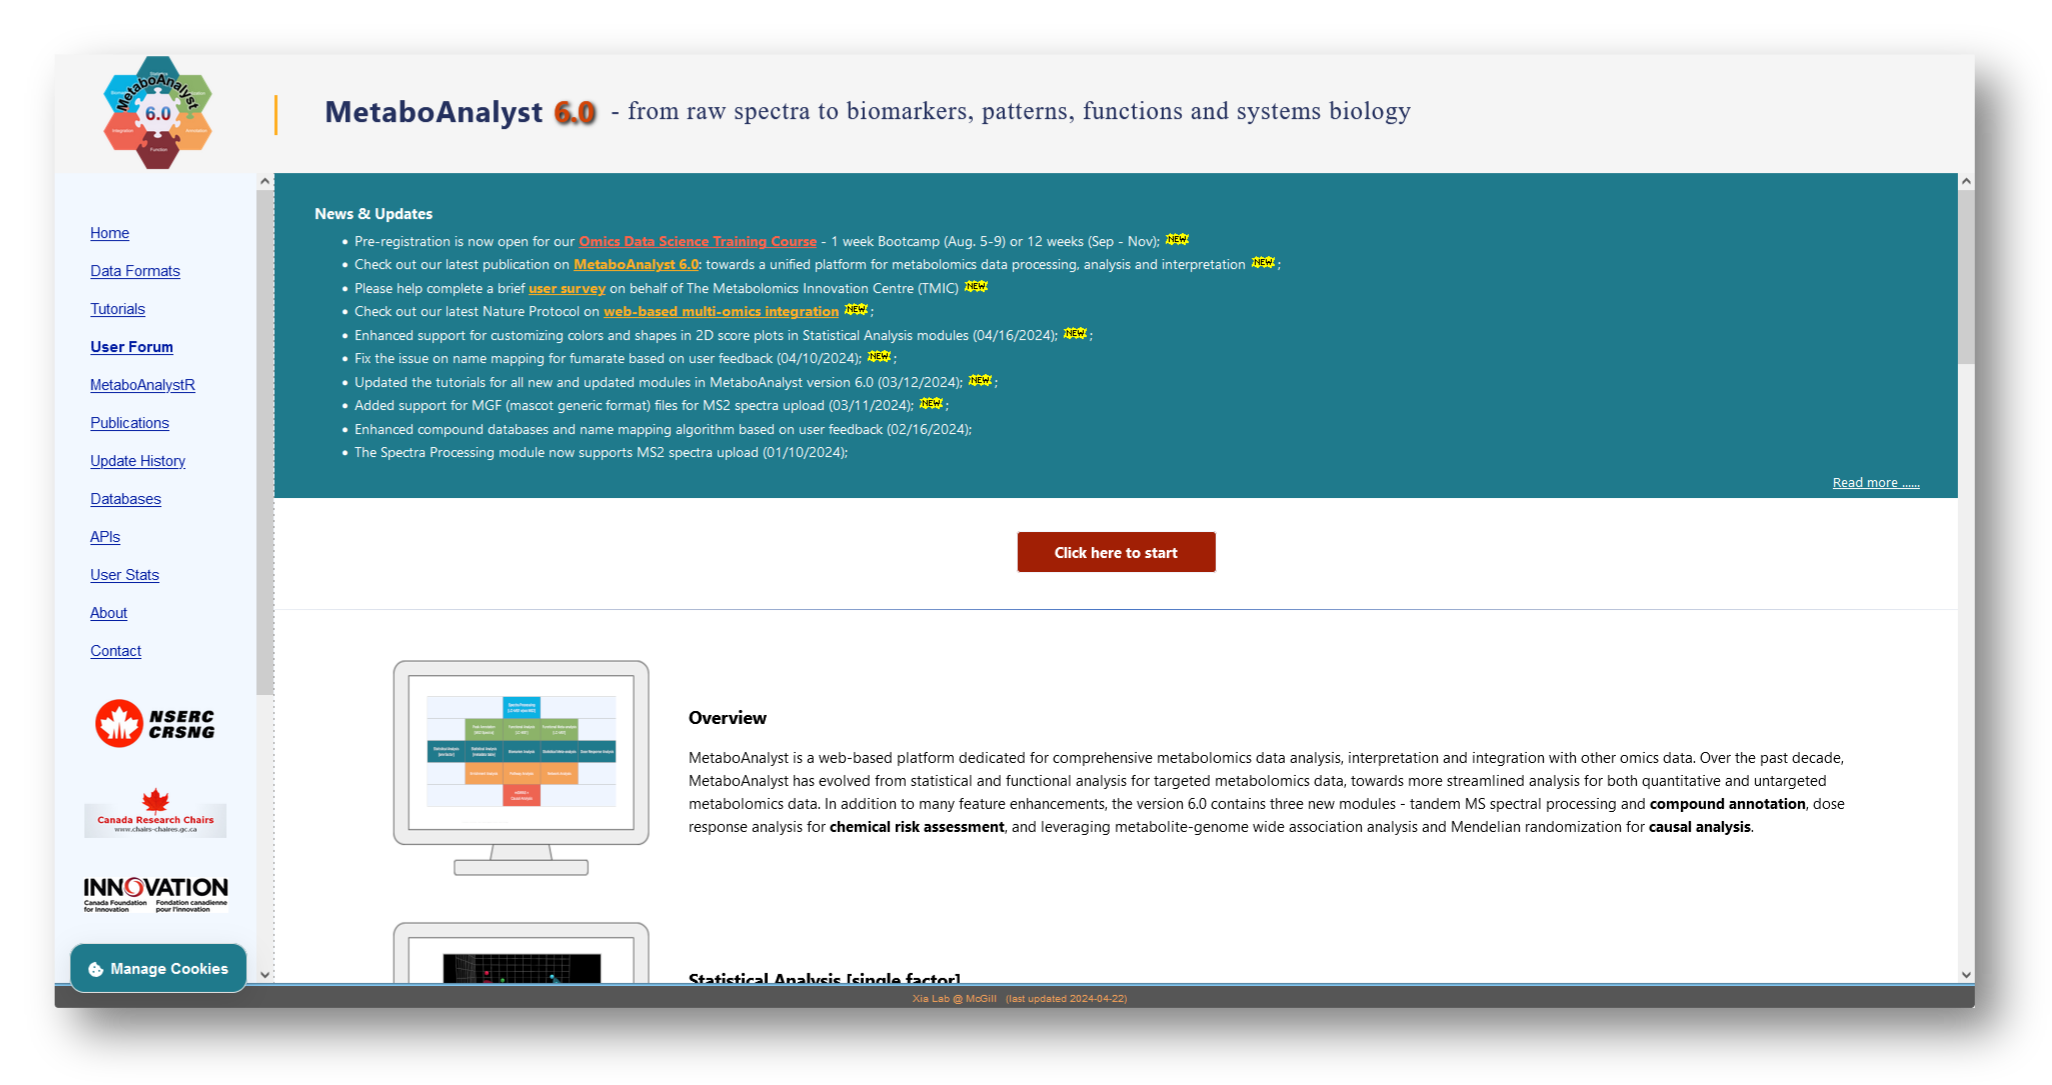
Welcome
Welcome to MetaBridge, a user-friendly web tool for network-based integrative analysis of metabolomics data. Here you can upload a list of metabolite IDs and identify the directly interacting enzymes for network integration.
To start, you'll want a set of metabolites as HMDB or KEGG IDs. We recommend MetaboAnalyst for metabolomics data processing and ID conversion, if you have only compound names.
With the output of MetaBridge, you can create a protein-protein interaction network using your metabolomics data. We suggest NetworkAnalyst for generation of these networks, and for network-based integration with data from other omics types.
Click the button below to get started! If you'd like to learn more about how MetaBridge can be used, check our Tutorial. For more information, including where to report bugs or problems and how to cite MetaBridge, please refer to the About page.
Tutorial
Network-based integrative analysis with MetaBridge
This page covers a sample workflow for integrating your metabolomics data with transcriptomics or proteomics data using network-based approaches.
1. Metabolite Preprocessing (Optional)
To get started with MetaBridge, you'll need to upload your list of compounds as HMDB or KEGG IDs. If you are starting with raw metabolomics data (i.e. compounds names, such as glucose), you will need to preprocess your metabolites with your method of choice to obtain their corresponding HMDB or KEGG IDs. We recommend MetaboAnalyst for metabolite preprocessing and ID mapping, available by selecting "Other Utilities" then "Compound ID Conversion."
MetaBridge mapping
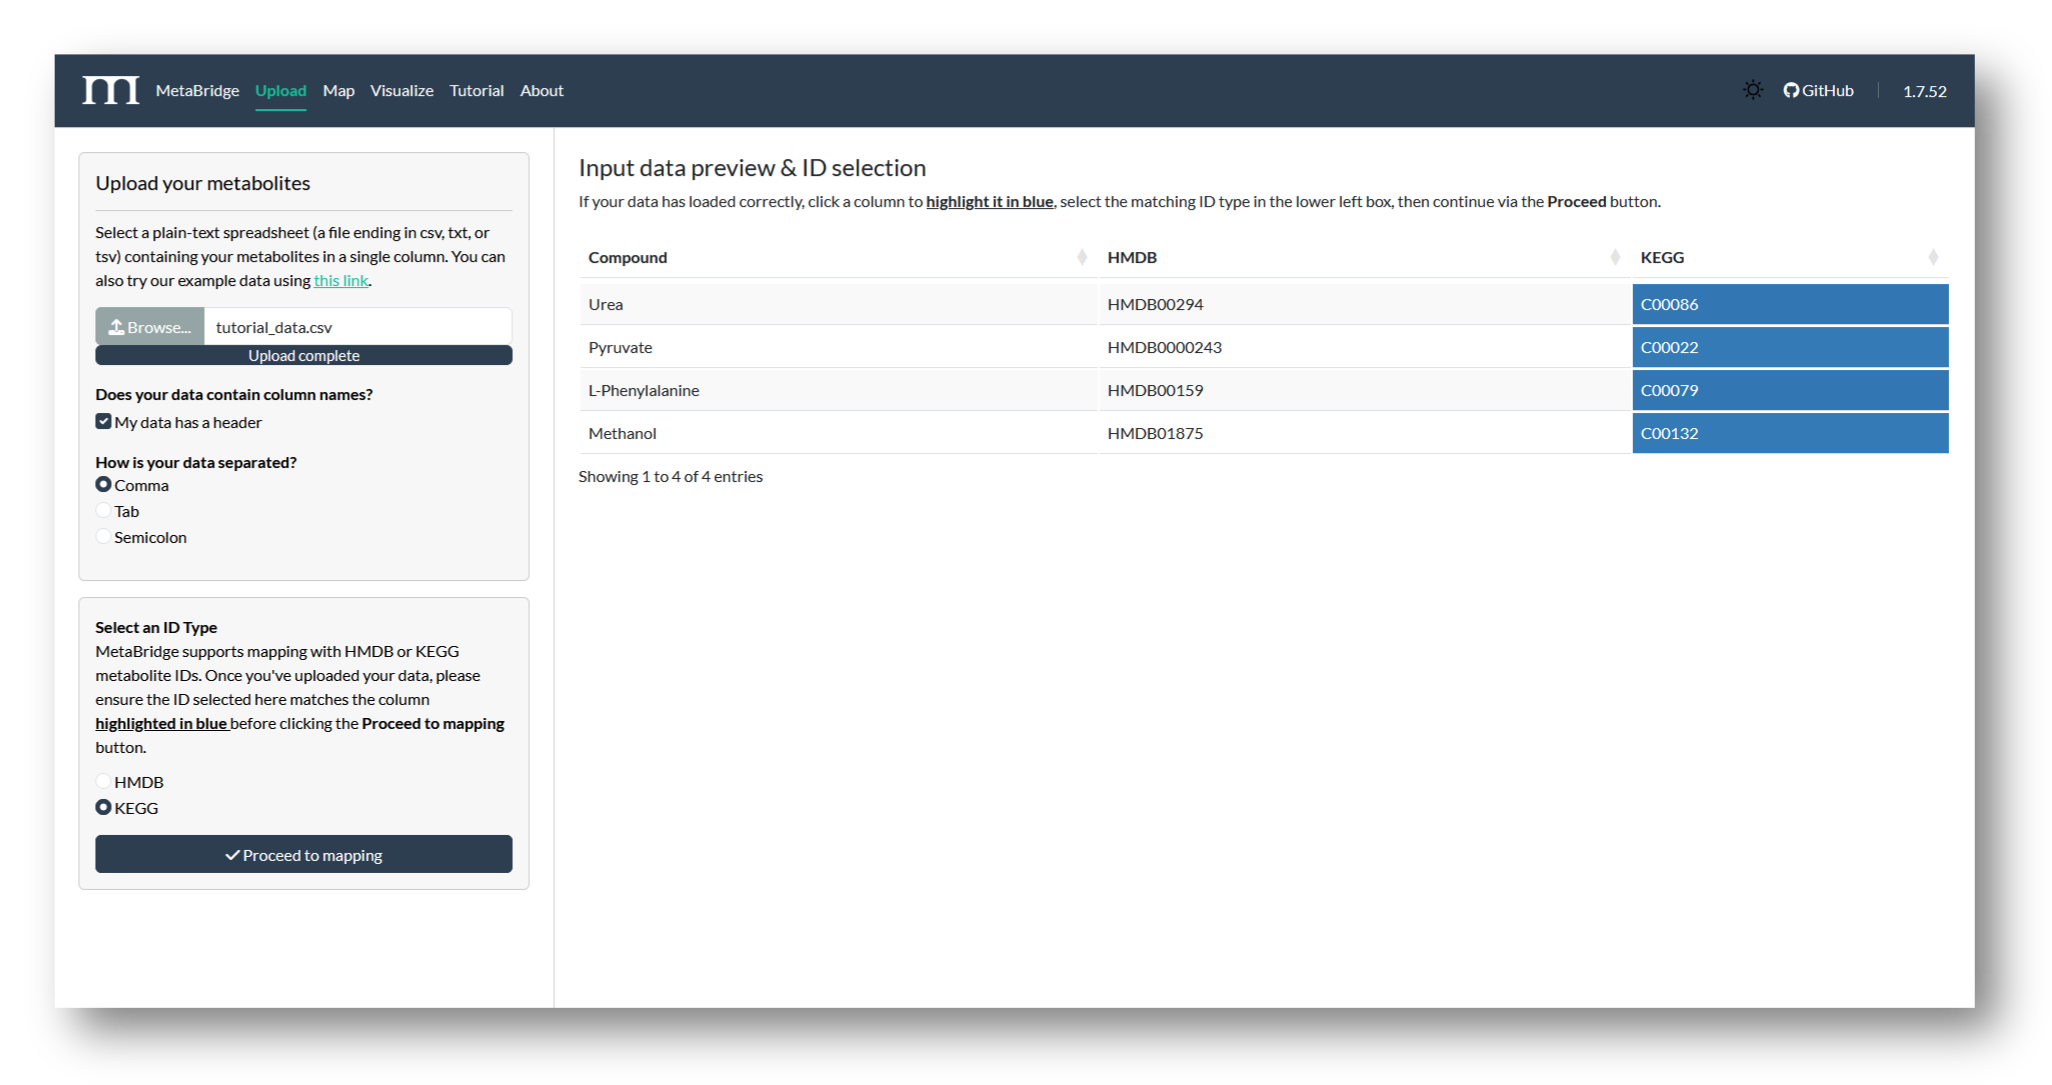
2a. Upload metabolites
Navigate to MetaBridge and upload the file containing your metabolite IDs. Then, select the column to be used in the mapping and the matching ID type (HMDB or KEGG). We'll use KEGG IDs for this tutorial.
2b. Map metabolites
Choose a database to map against, and view your mapping results. Here, we've mapped our metabolites via KEGG, to maximize the number of genes MetaBridge returns.
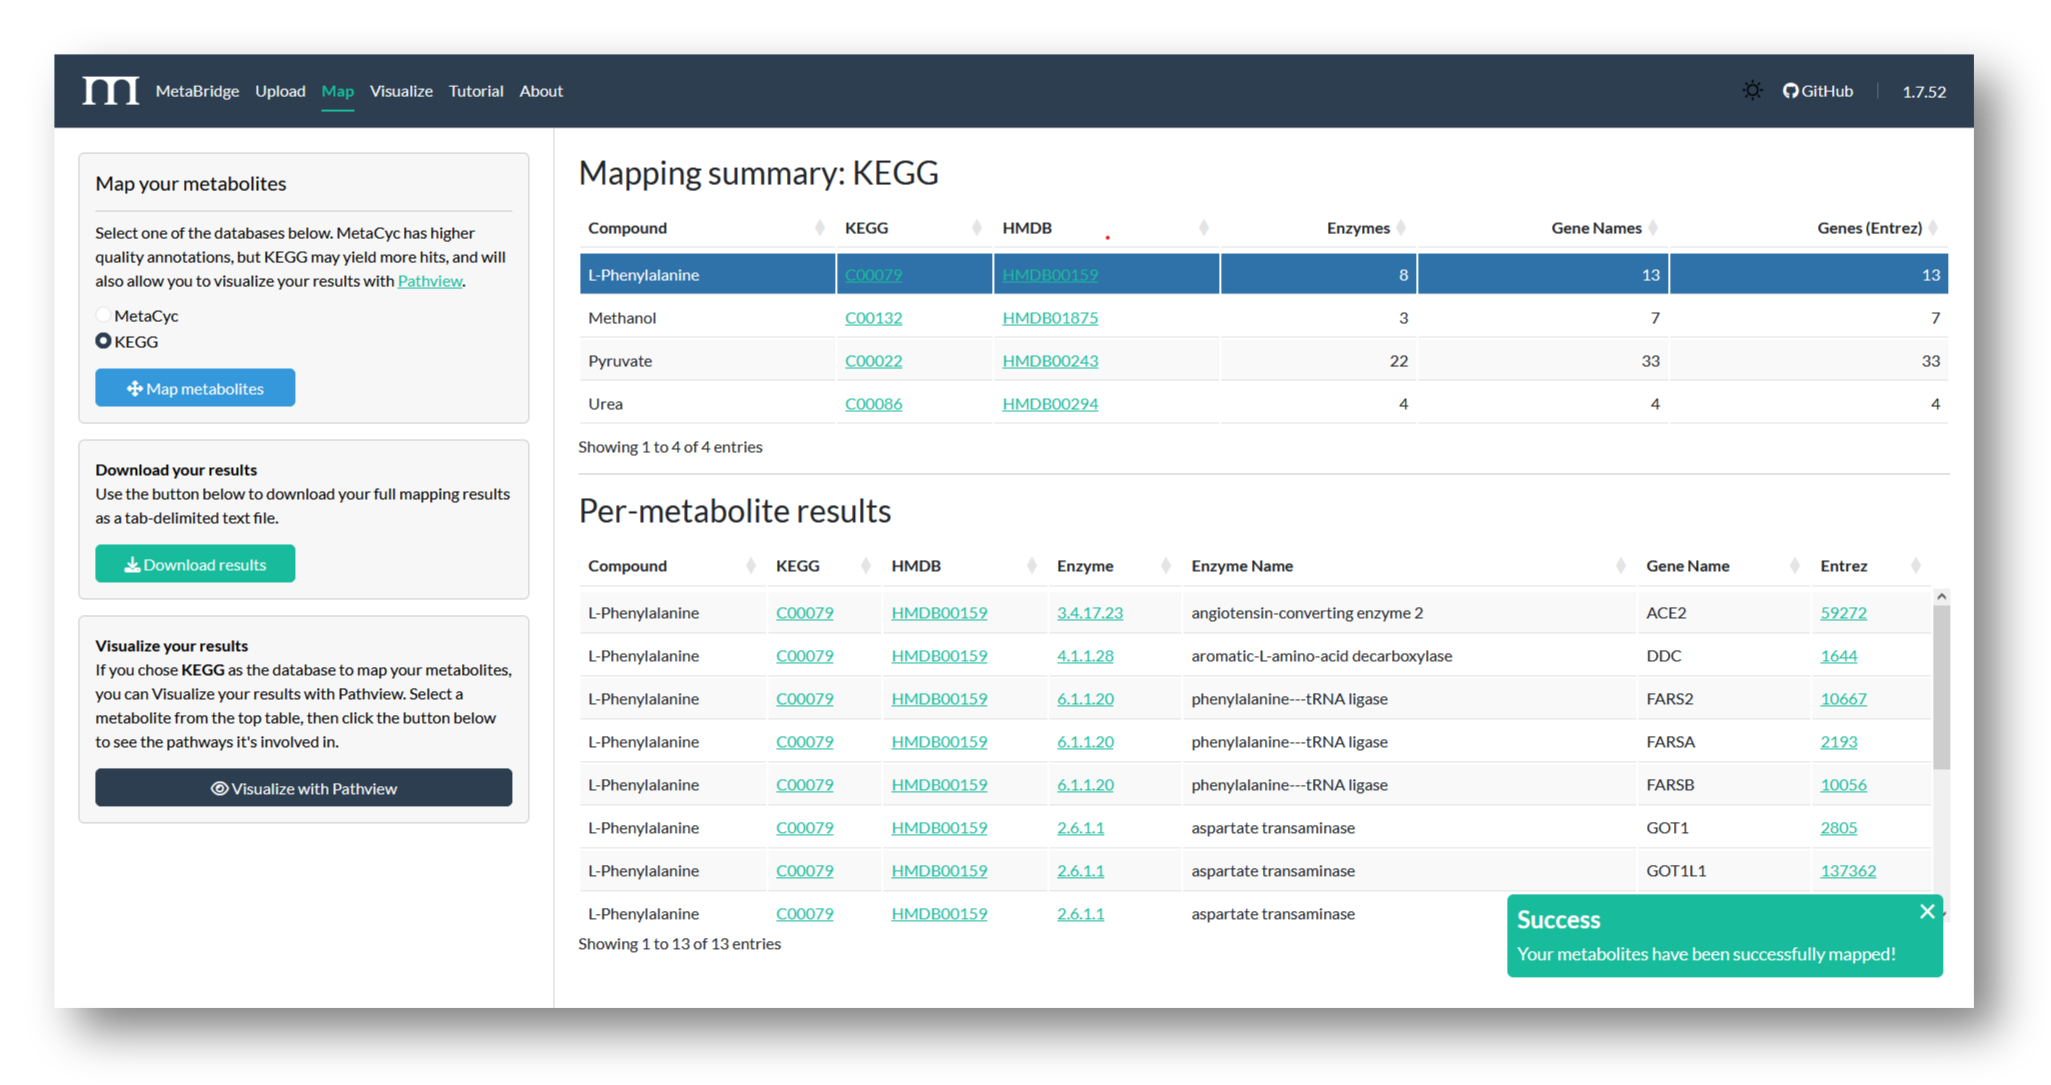
2c. Download Results
Use the button to download your full mapping results from MetaBridge - the table below shows the first few rows from our mapped data.
| Compound | KEGG | HMDB | Enzyme | Enzyme Name | Gene Name | Entrez |
|---|---|---|---|---|---|---|
| Urea | C00086 | HMDB00294 | 3.5.3.1 | arginase | ARG1 | 383 |
| Urea | C00086 | HMDB00294 | 3.5.3.1 | arginase | ARG2 | 384 |
| Urea | C00086 | HMDB00294 | 3.5.3.4 | allantoicase | ALLC | 55821 |
| Urea | C00086 | HMDB00294 | 3.5.3.11 | agmatinase | AGMAT | 79814 |
| Pyruvate | C00022 | HMDB00243 | 1.1.1.27 | L-lactate dehydrogenase | LDHAL6A | 160287 |
3. NetworkAnalyst
3a. Upload mapped genes
Visit NetworkAnalyst and select [Gene List Input] from among the possible options.
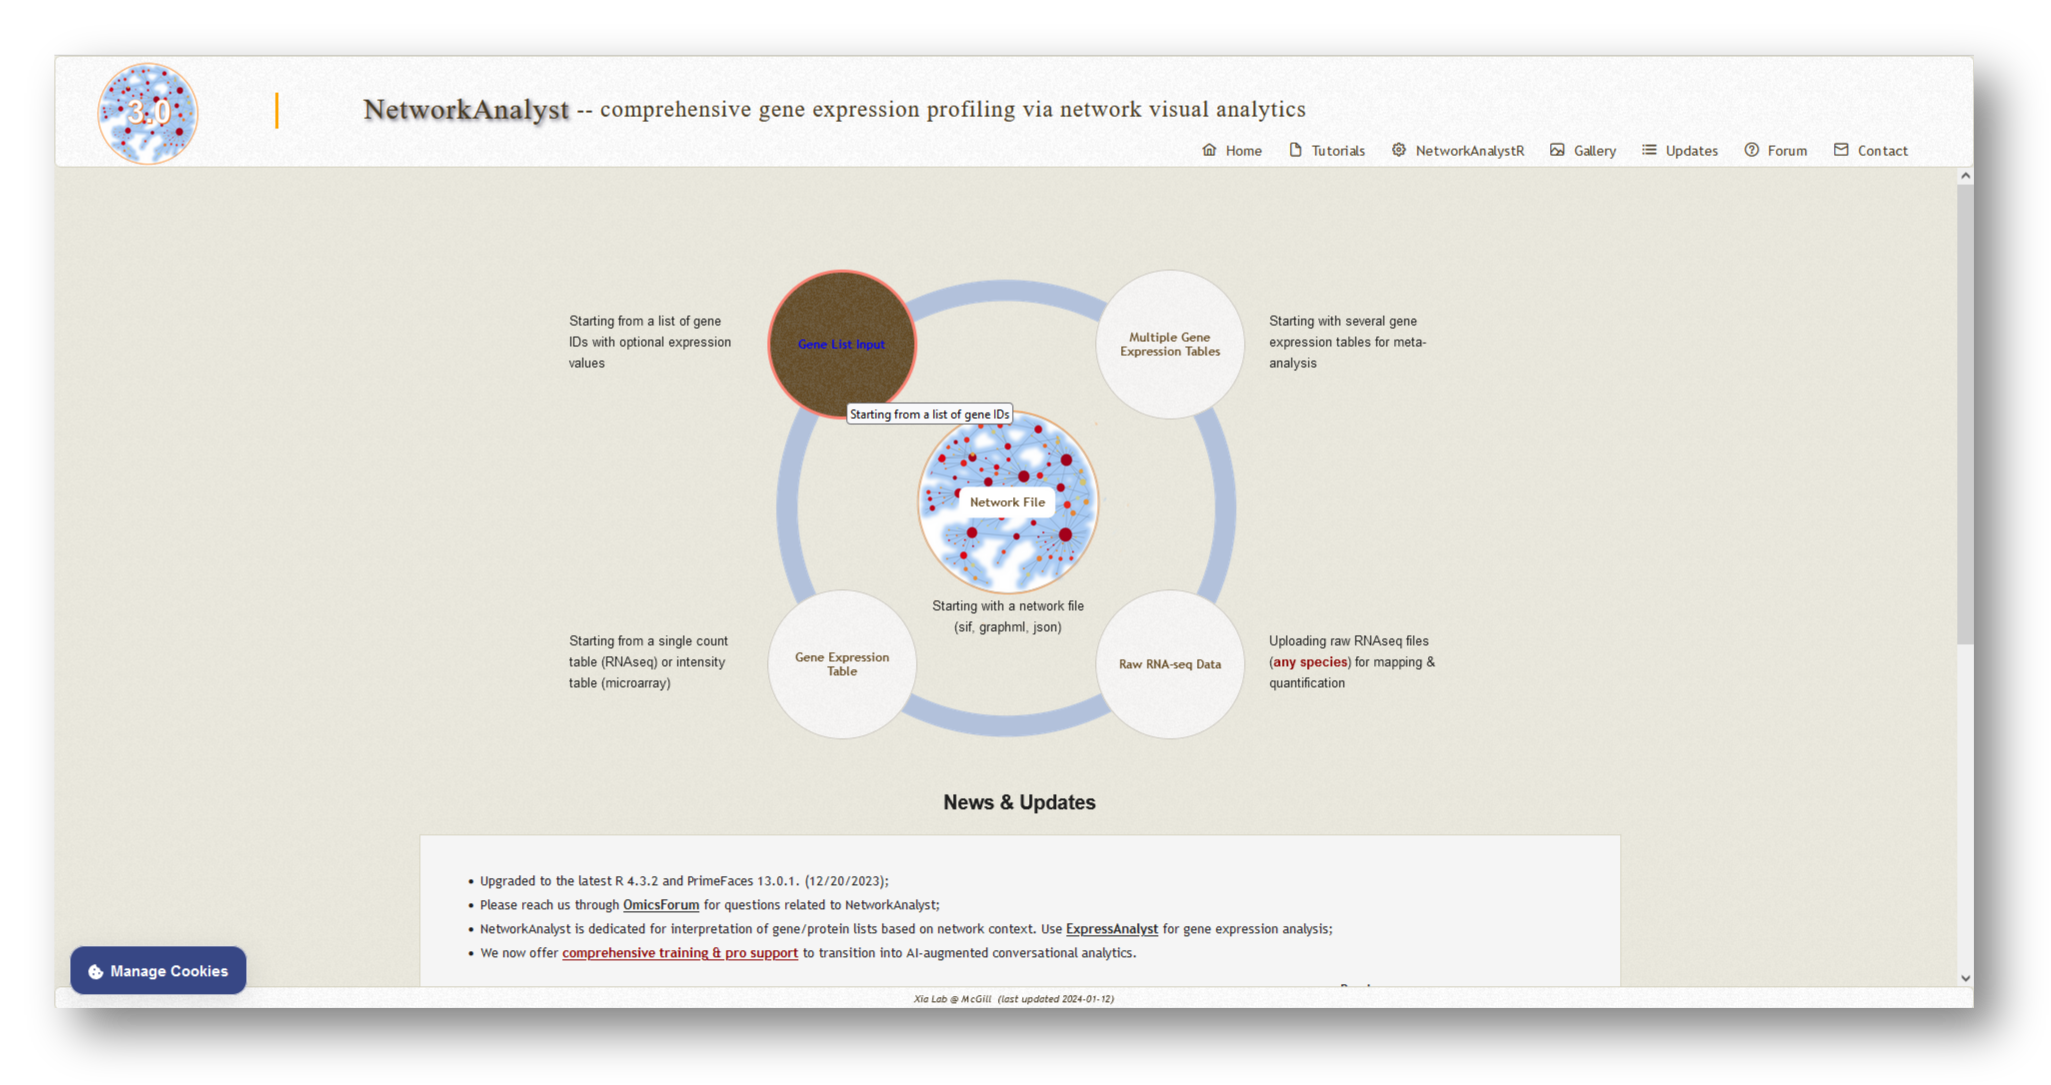
Follow the steps below to upload your gene lists to NetworkAnalyst:
- Paste in the genes that you received from MetaBridge
- Repeat this for each gene or protein list you wish to integrate, separating each list with a `//` as instructed
For this tutorial, we've uploaded two gene lists - our mapped metabolites from MetaBridge, and the endotoxin tolerance signature.
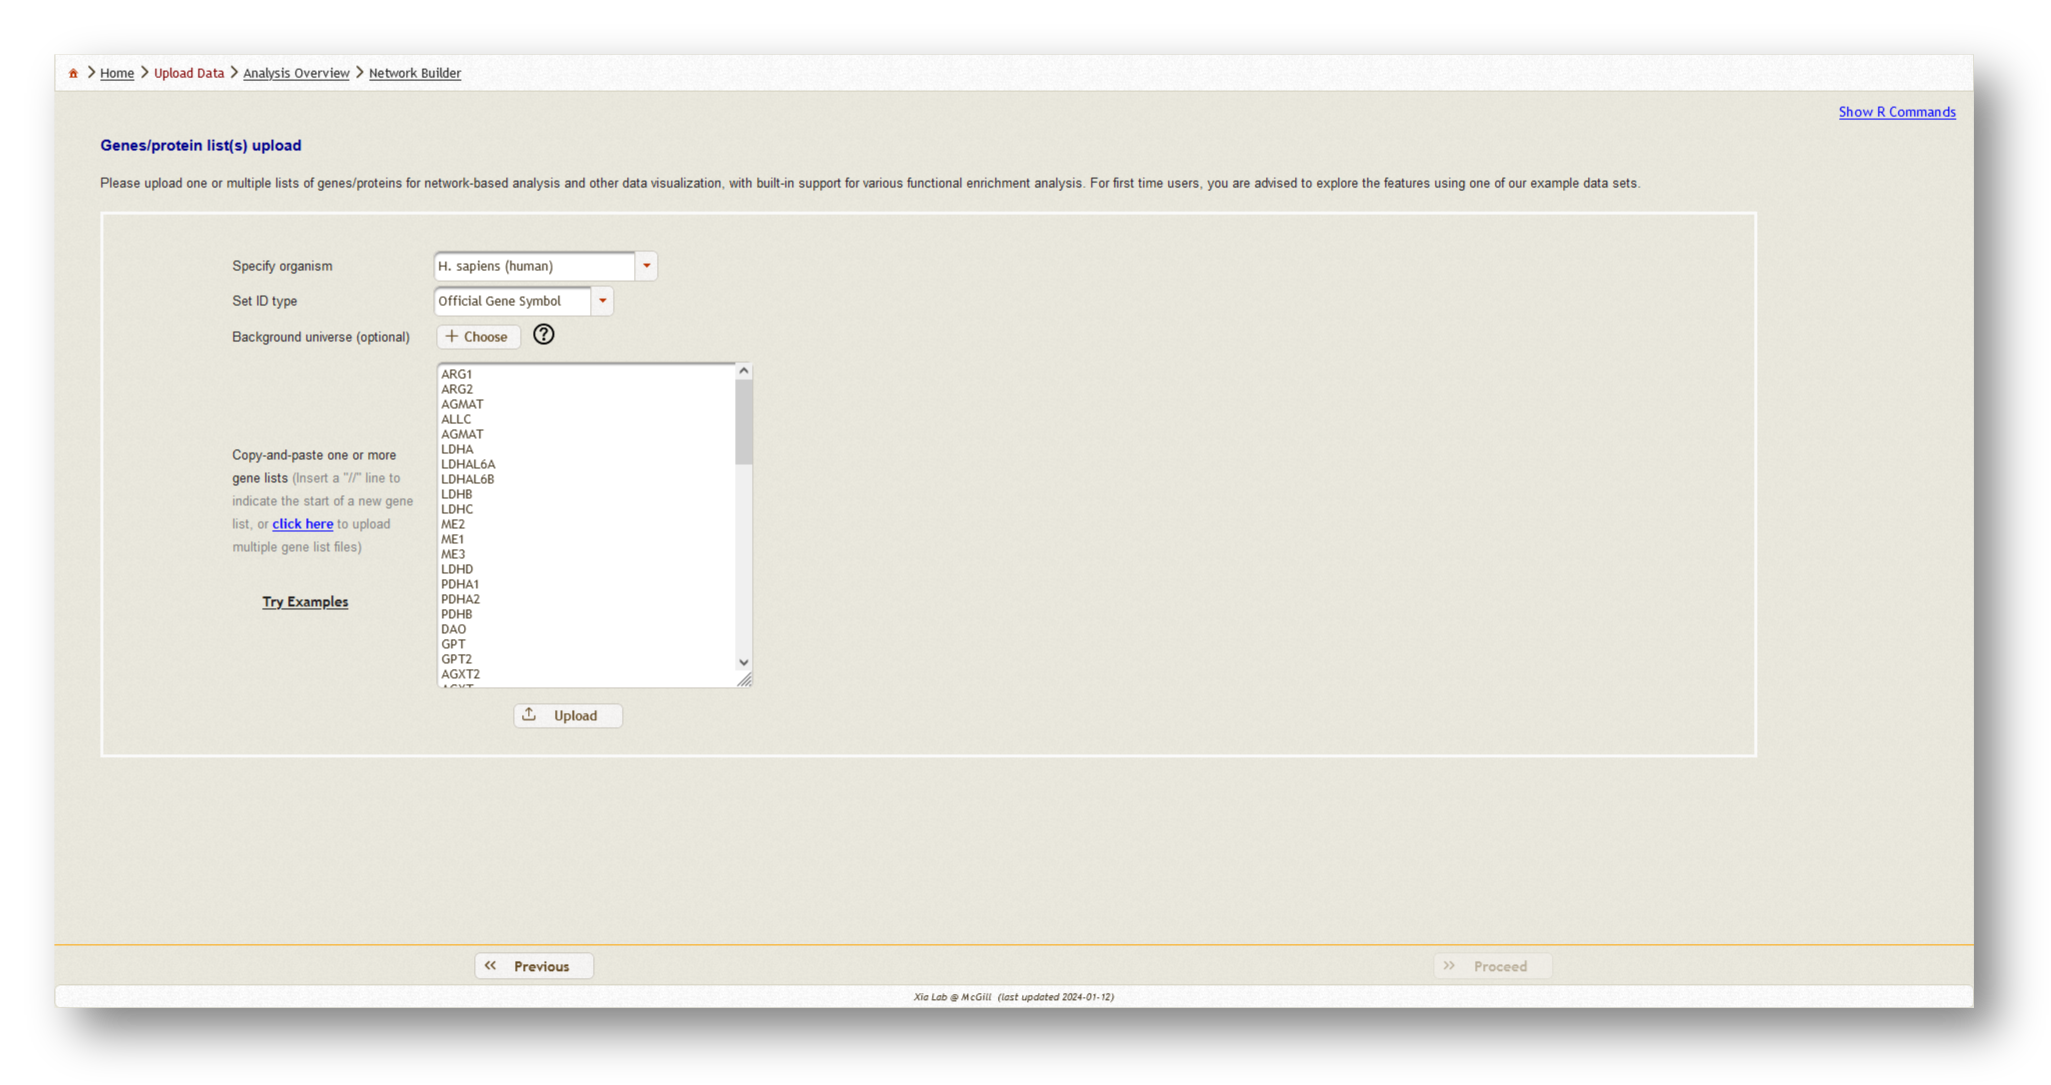
Once you have uploaded all of your gene/protein lists, select "Homo sapiens" as the organism, and "Official gene symbol" as the ID type.
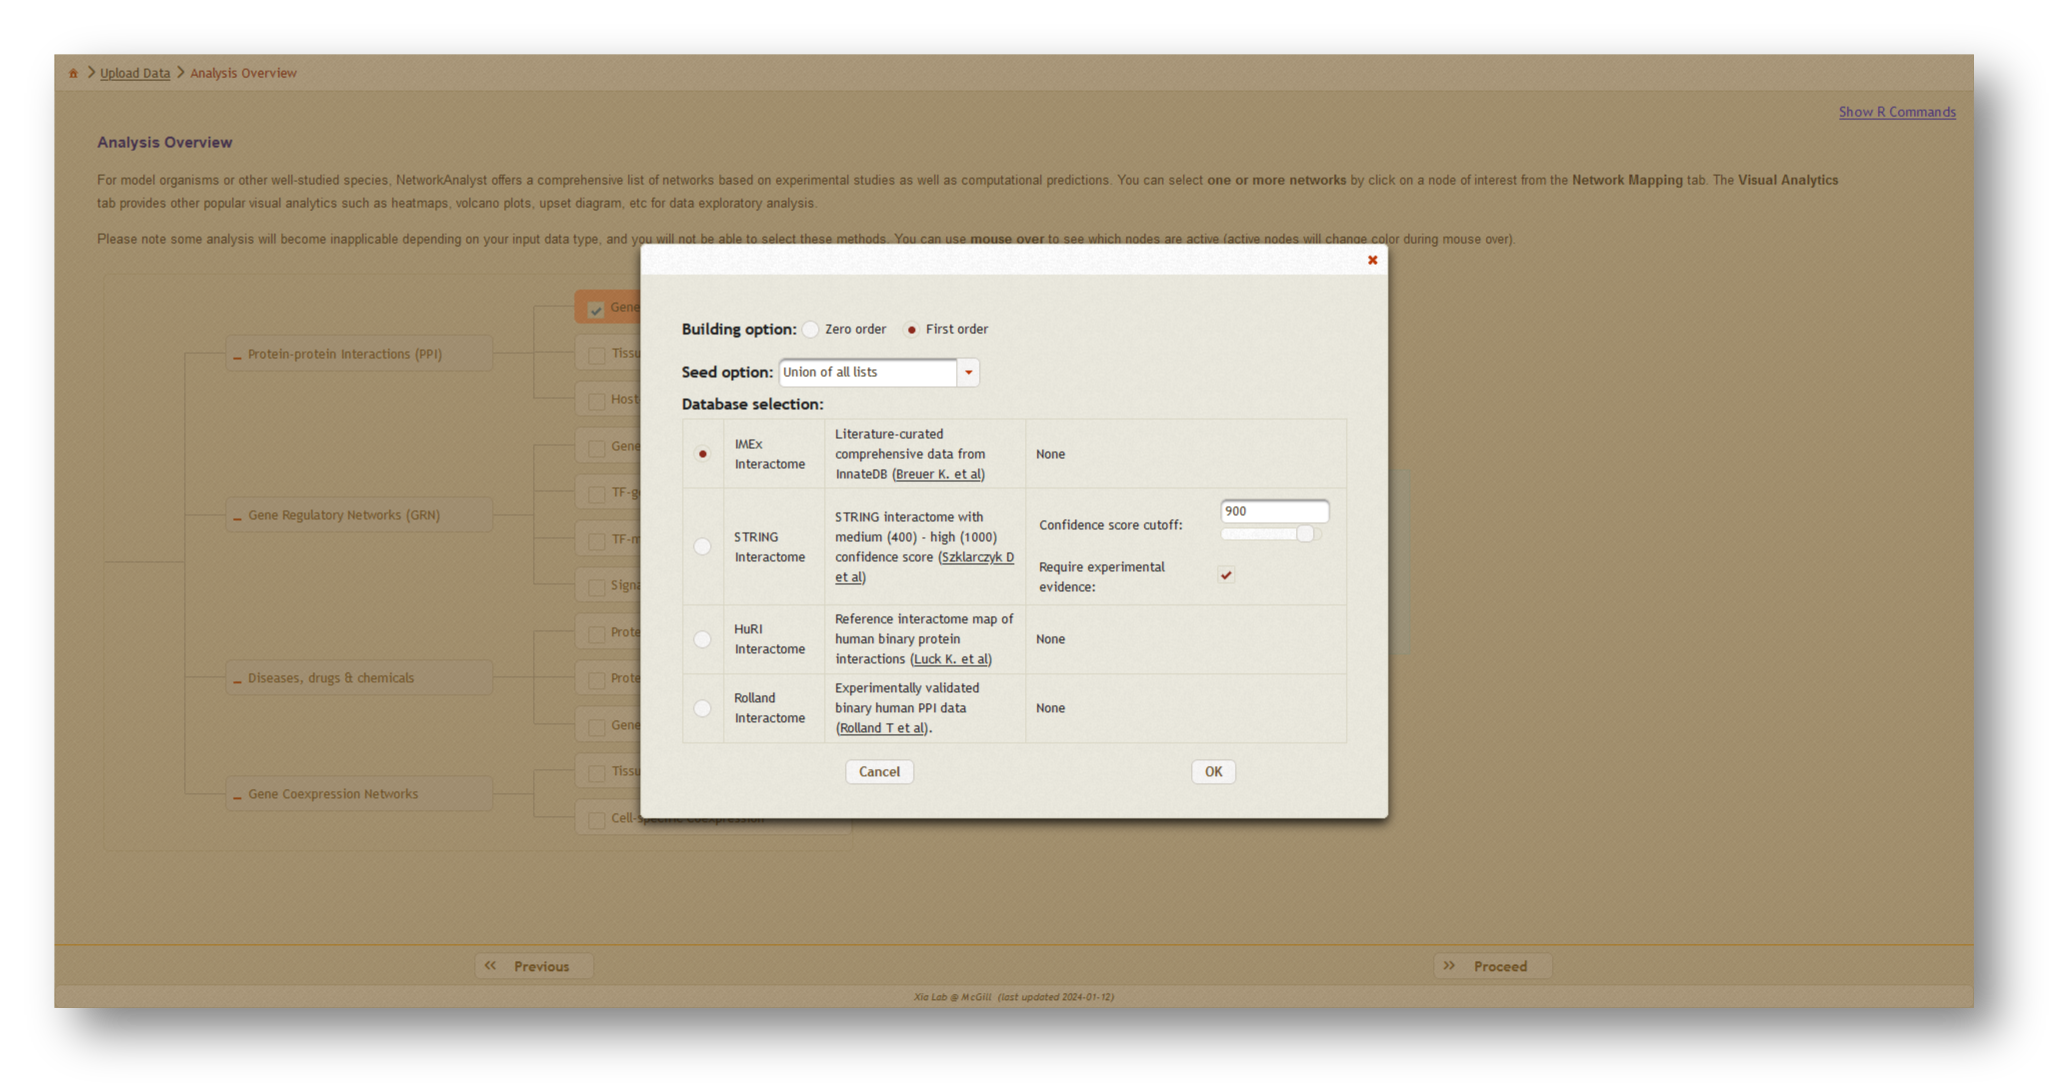
Next, click [Proceed], then choose [Generic PPI] which will open a dialog box. At the top, select "Union of all lists" to create the combined network, then choose the literature-curated IMEX Interactome as your protein-protein interaction (PPI) database. Click [OK], then [Proceed] to continue.
3b. Network creation
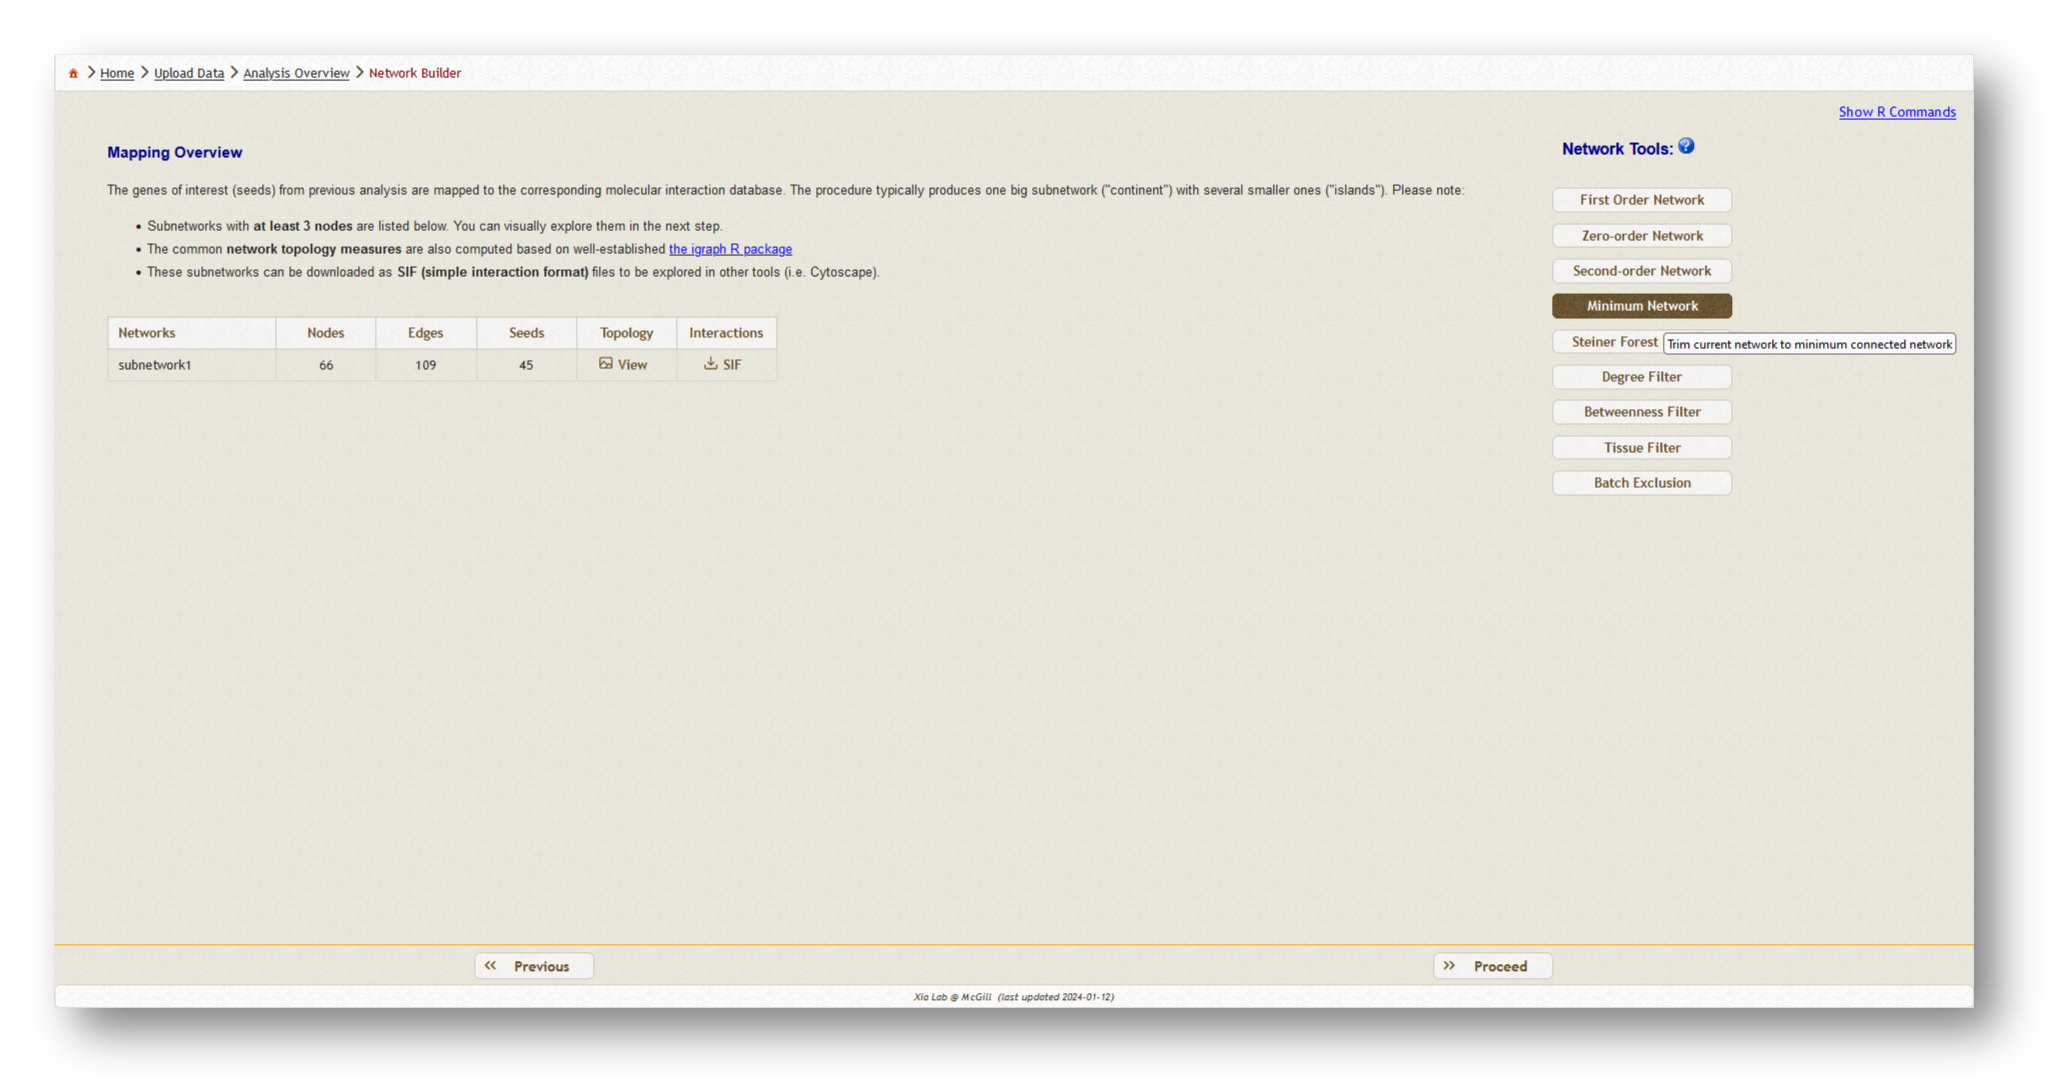
Now, a PPI network will be generated based on the data you have uploaded. Depending on the size of the dataset you have uploaded, you may wish to choose a different network type from the list of options on the lefthand side. Generally, we recommend using a minimum-connected PPI network. However, if your data are particularly sparse, you may need to use first-order interaction networks, whereas if your dataset is particularly large, you may wish to use a zero-order interaction network. Typically, we aim for a network containing a few hundred nodes. Try the different options and see how the number of nodes/edges change, then pick the appropriate type and [Proceed] to visualization.
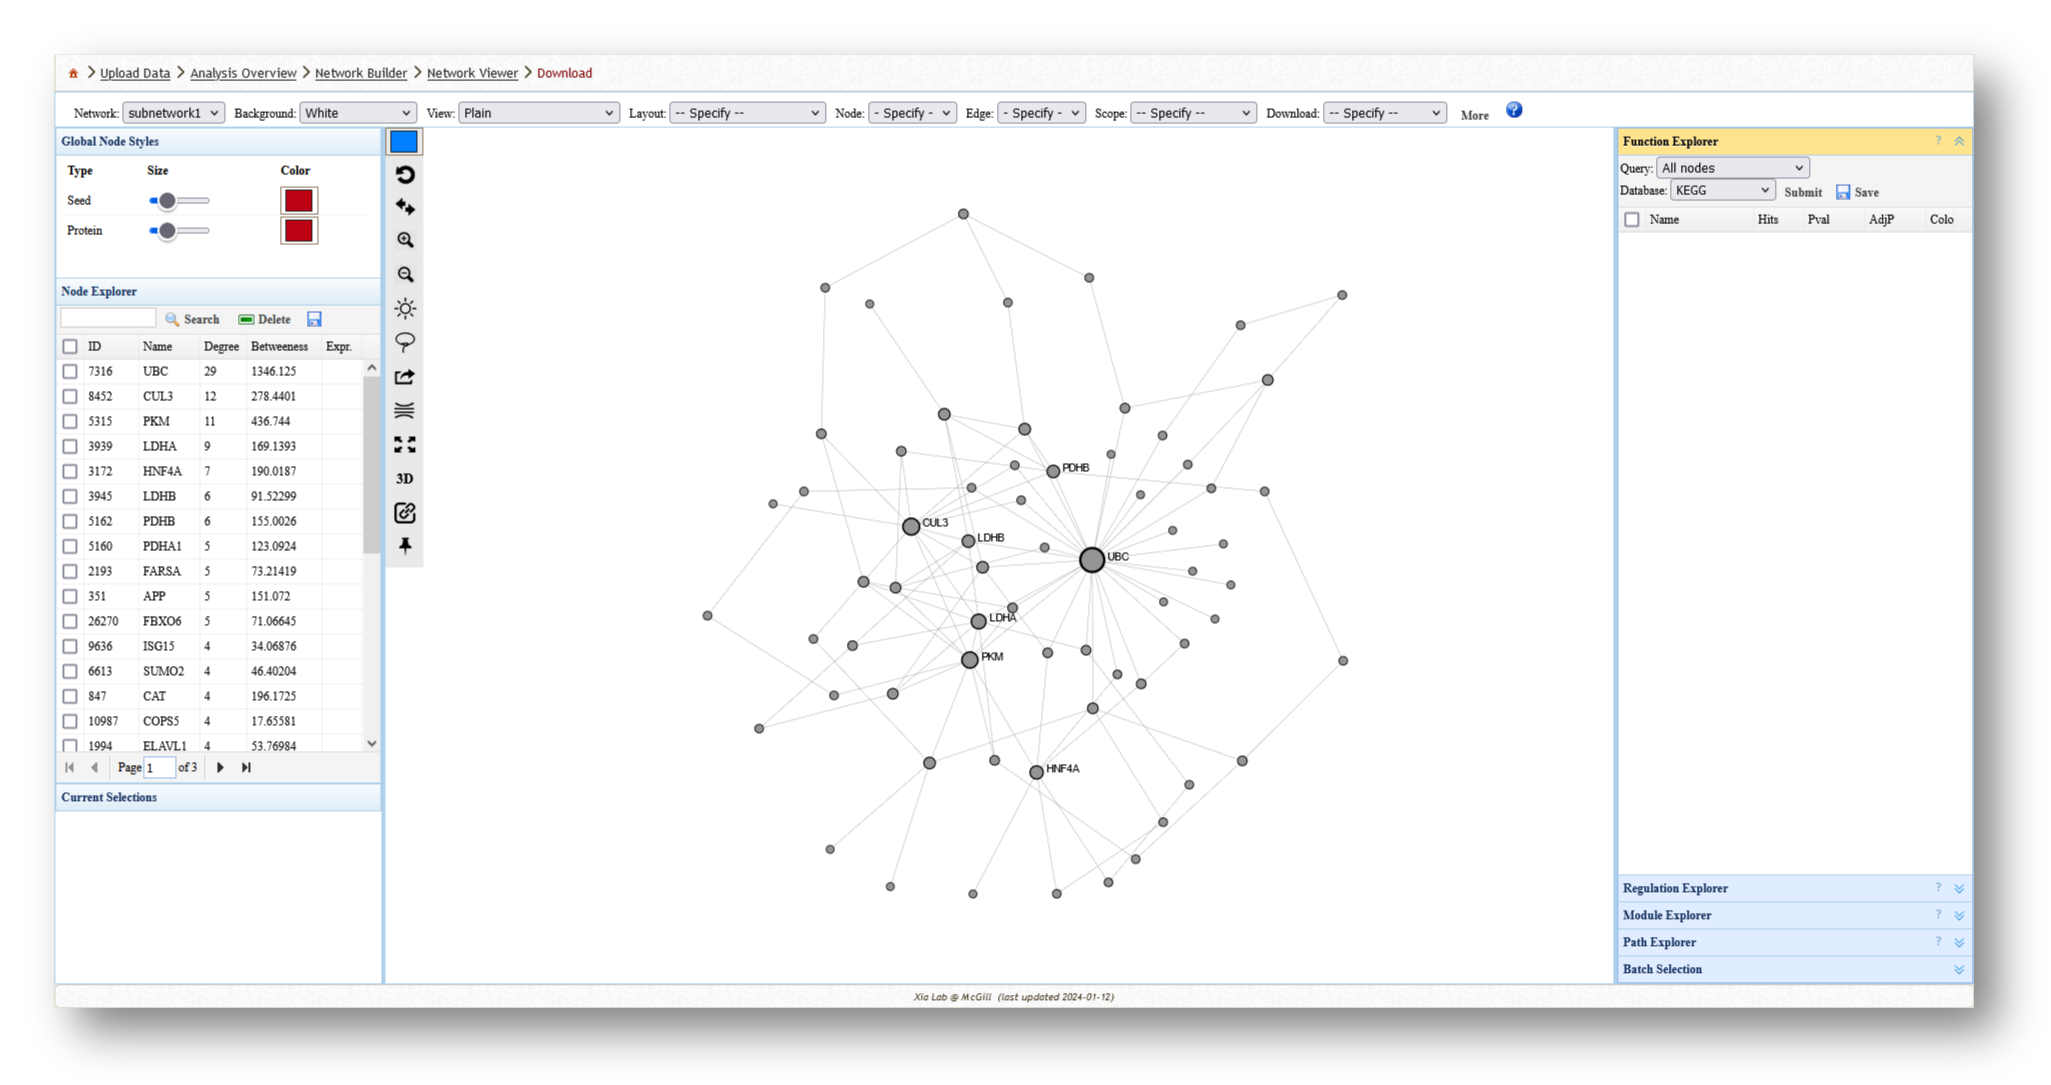
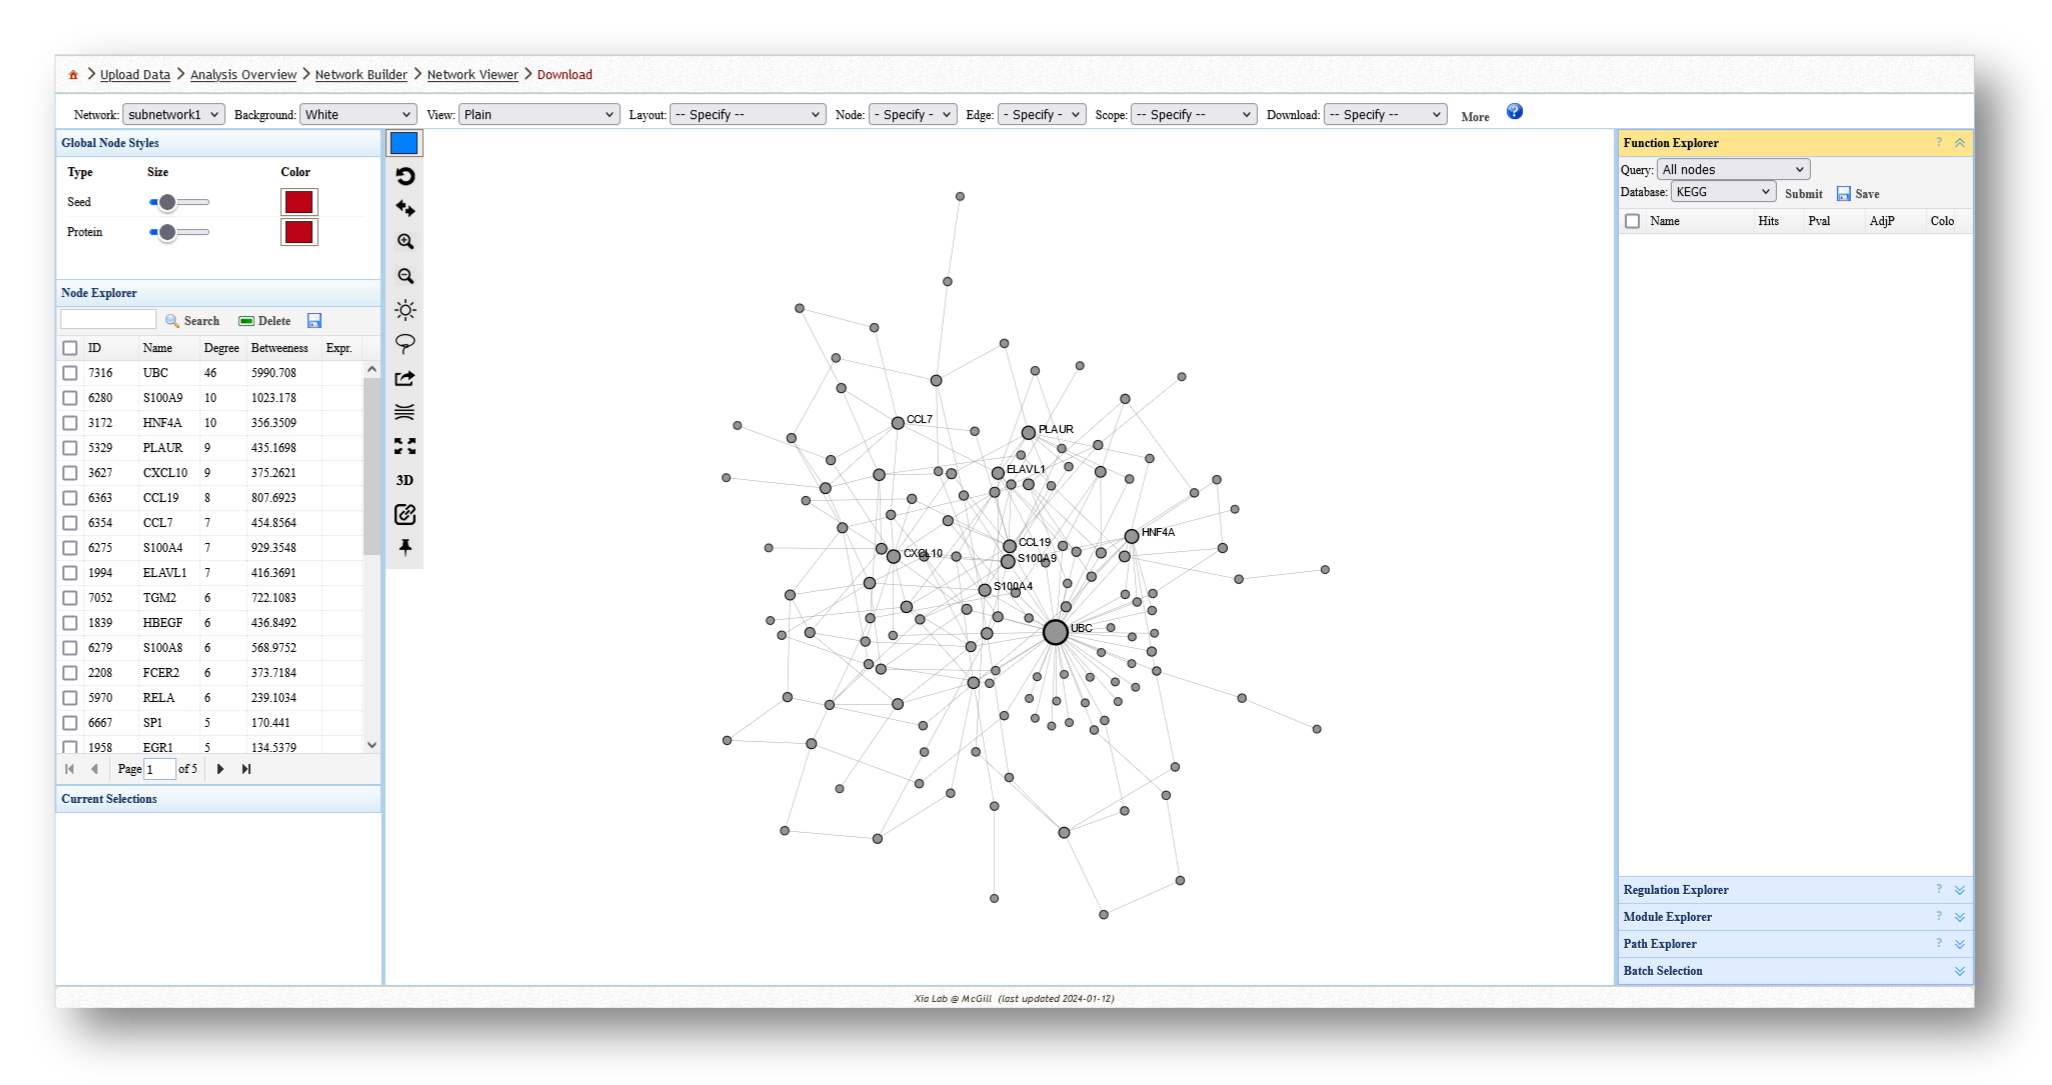
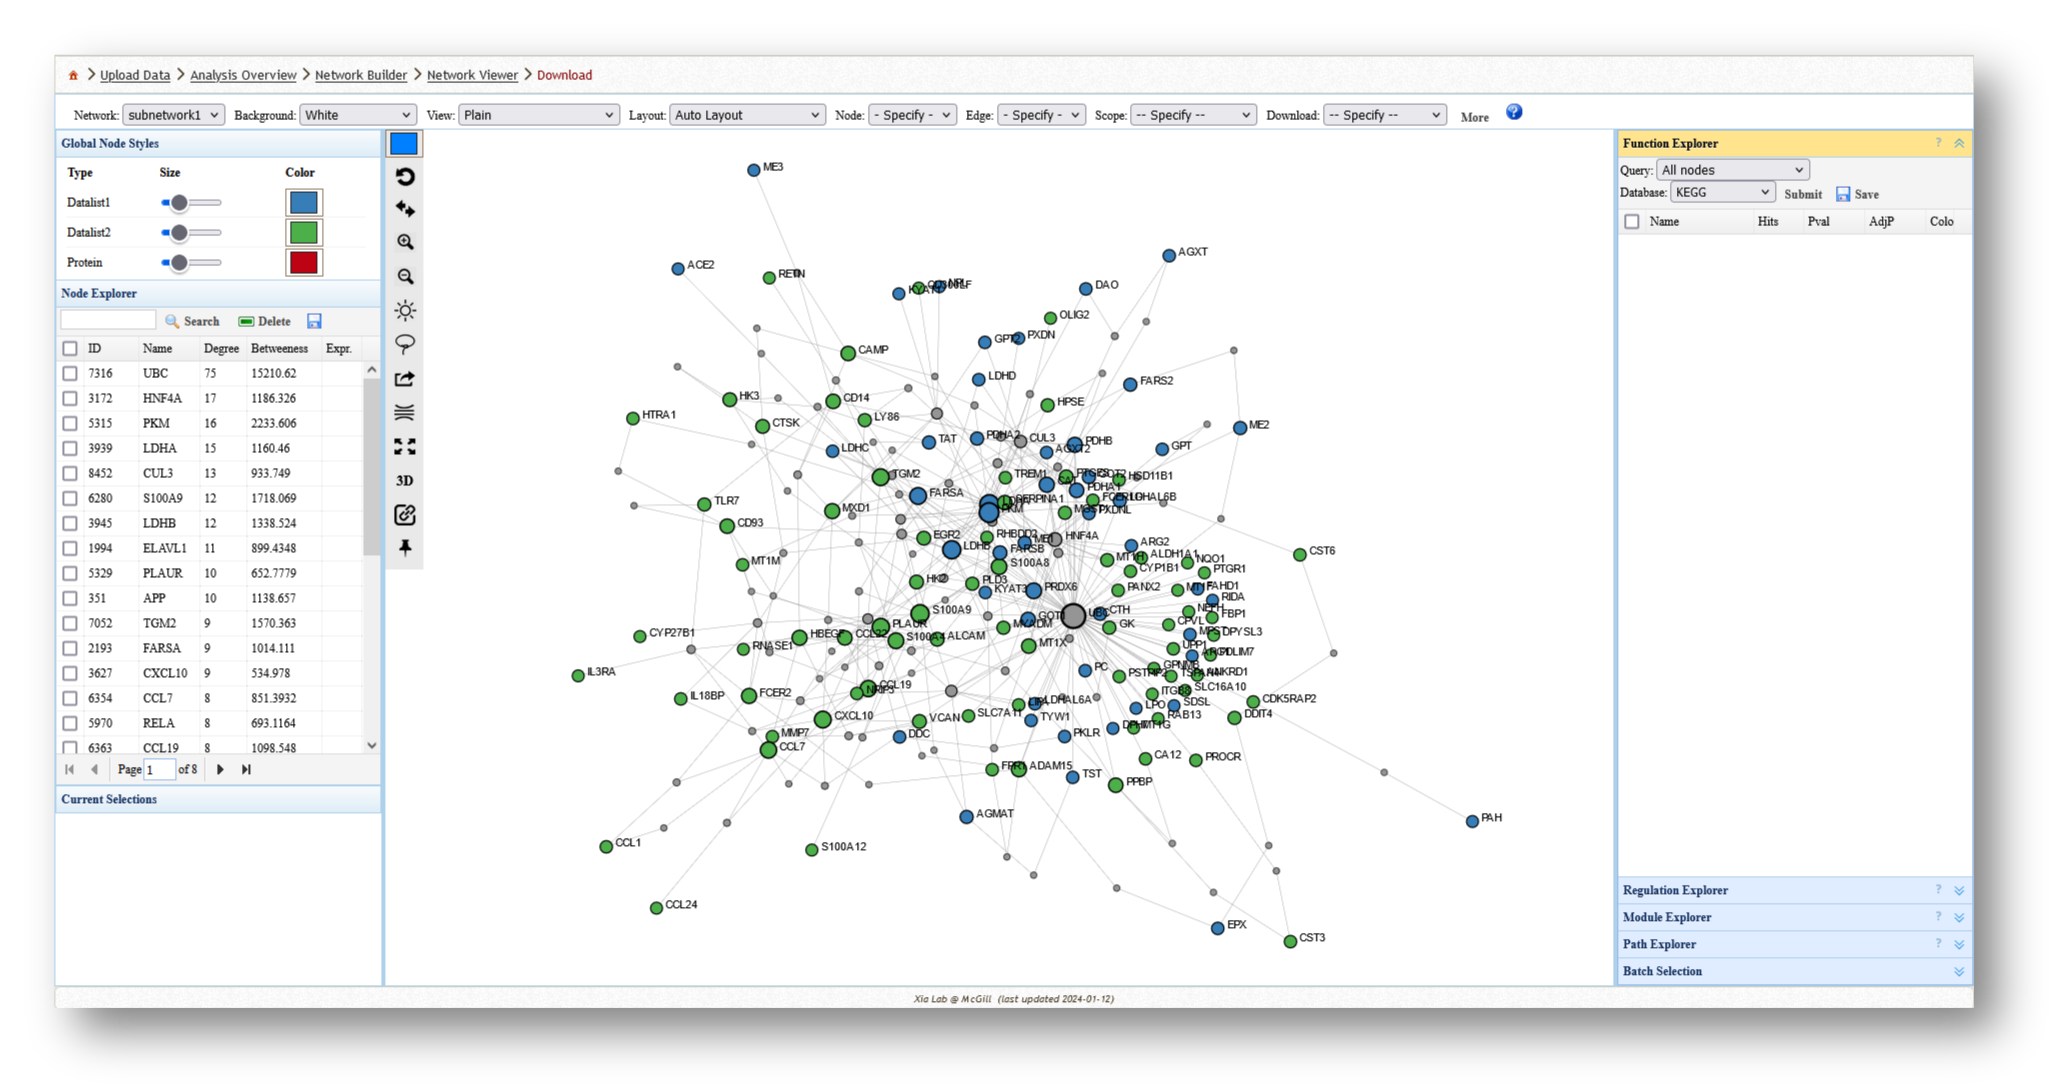
Below, you will find an example of each minimum-connected network generated from the two individual gene lists, and the combined list.
- Minimum-connected PPI network from our MetaBridge-mapped metabolites.
- Minimum-connected PPI network from the endotoxin tolerance signature.
- Minimum-connected PPI network from combined gene list.
3c. Analyze the Networks
For each network you create, you can extract various information and perform a few different analyses. For example, you can use the [Function Explorer] panel on the right side to perform pathway enrichment on the current network using a number of databases, such as Reactome or KEGG. On the lefthand side, you can use the [Node Explorer] to view information about individual nodes of the network, and [Save] the entire node list as a CSV file for further analysis outside of NetworkAnalyst.
You can also tweak the network appearance in a number of ways. By increasing the node size, more labels will be added to the nodes in your network. Then, you can download your network as an image (e.g. PNG or SVG) or network file (e.g. graphML or JSON).
About
MetaBridge was created by Samuel Hinshaw, and is maintained by Travis Blimkie at the REW Hancock Laboratory at The University of British Columbia. It was originally published in Bioinformatics (doi: 10.1093/bioinformatics/bty331); please cite this paper when using MetaBridge in your analyses. We also have a protocol for MetaBridge published in Current Protocols in Bioinformatics. It covers how to prepare data for input to MetaBridge, and includes an example of building a protein-protein interaction network from MetaBridge results using NetworkAnalyst. The article is available at doi: 10.1002/cpbi.98.
The example data used by MetaBridge is based on results from a metabolomics study of pediatric sepsis published by Mickiewicz et al., available here.
If you encounter any bugs or run into other troubles, please post an issue at the GitHub page. Be sure to include detailed information on the error you received, and the input you used, if possible.
MetaBridge uses the following databases and packages:
- bslib
- A modern UI toolkit for Shiny based on Bootstrap.
- KEGG Release 109
- Large database containing multiple data types.
- MetaCyc v27
- Curated database for human metabolomic data.
- shiny
- Web application framework for R.
- shinycssloaders
- Animated loaders for Shiny outputs.
- shinyjs
- Improve the user experience of your Shiny apps in seconds.
- tidyverse
- A collection of R packages designed for data science.
- pathview
- Pathway-based data integration and visualization.